Back to LandBech Tool

Built-in instruments

A real diagnostic workbench inside one application

Every screenshot below is a real instrument running against a connected phone — no mockups, no marketing renders. The numbers come from real kernel sources: `/proc/stat`, `/sys/class/thermal/thermal_zone*`, the fuel-gauge driver, `dumpsys telephony.registry`, `wpa_supplicant`, IOKit on iOS. The app glues them together into instruments you actually recognize from your bench.

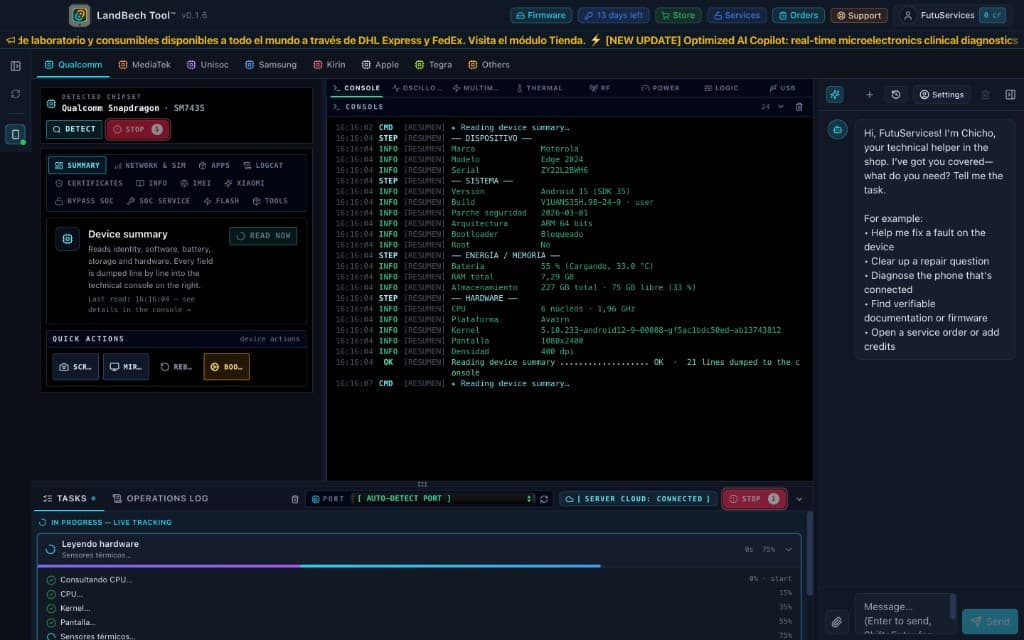
Chipset workbench — Qualcomm / MediaTek / Exynos / Apple

Chipset dashboard

Chipset workbench — Qualcomm / MediaTek / Exynos / Apple

One dashboard per SoC family. Detects the silicon, dumps identity, software, hardware and energy in a single click.

Built around the same kind of layout a Z3X / Octoplus / UMT operator expects: family tabs (Qualcomm, MediaTek, Unisoc, Samsung, Kirin, Apple, Tegra), a real DETECT button, the technical console on the right streaming every line of the read-out, and the live task tracker on the bottom showing each step (CPU, kernel, screen, thermal sensors) with its own percentage.

  • Real DETECT command — ADB getprop, dumpsys, /proc, libimobiledevice on iOS.
  • Marca / Modelo / Serial / Build / Android / Security patch / Architecture / Bootloader / Root state.
  • Live progress: every read step posts its own line into the technical console.
  • Quick actions inline: Screenshot (scrcpy), Mirror, Reboot, Bootloader / EDL.
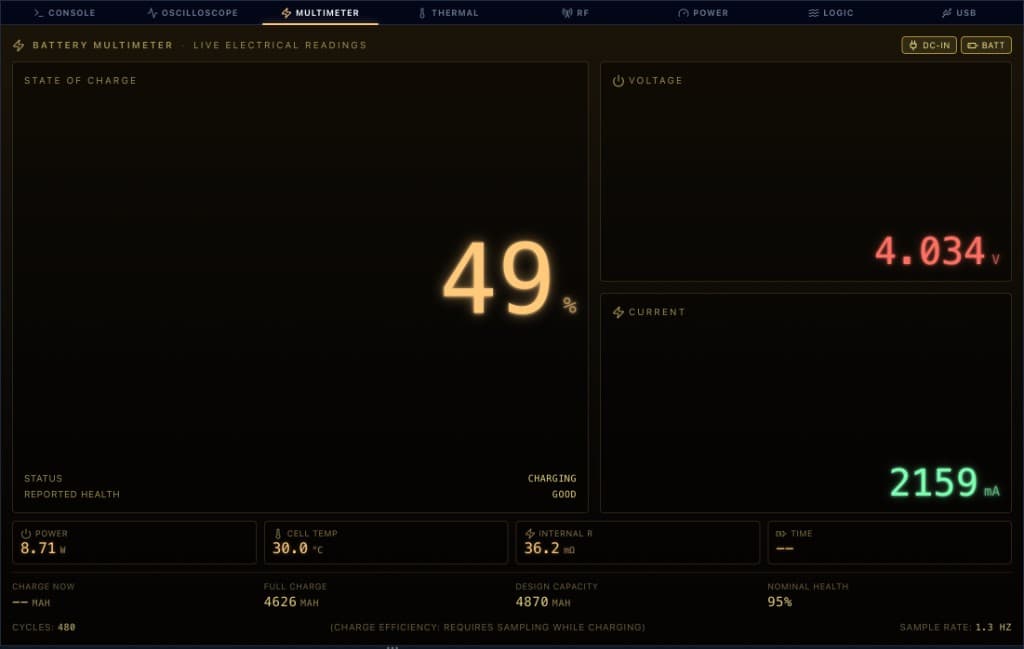
Battery multimeter — live electrical readings

Multimeter

Battery multimeter — live electrical readings

State of charge, terminal voltage, instantaneous current, power draw, cell temp, internal resistance and cycle count.

Reads the fuel-gauge of the phone in real time (V × I = W) and contrasts the design capacity against the current full-charge capacity to estimate nominal health. No mocks: numbers come straight from the battery sysfs/IOKit gauge.

  • SoC %, voltage V, current mA, power W, cell temp °C, internal resistance mΩ.
  • Design capacity vs full-charge capacity → nominal health %.
  • Cycle count when the platform exposes it (Android ≥ 13 / iOS via libimobiledevice).
  • Switch between BATT and DC-IN to inspect charging vs running on battery.
Power profiler — subsystem breakdown in watts

Power profiler

Power profiler — subsystem breakdown in watts

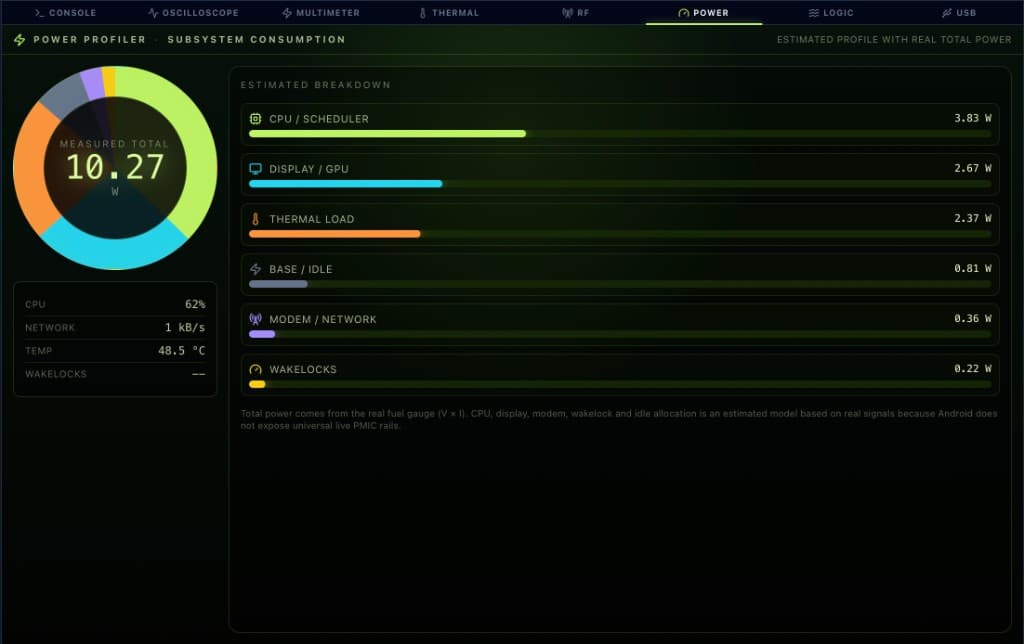
Total system draw on the left ring; CPU, display, modem, wakelocks, thermal load and base idle broken down on the right.

Total power comes from the real fuel gauge (V × I). CPU, display, modem, wakelock and idle allocation is an estimated model based on real signals because Android does not expose universal live PMIC rails. Useful to spot a phone drawing 3 W while idle or a runaway modem at 1.5 W.

  • Measured total = V × I from the fuel gauge (not a guess).
  • Per-subsystem allocation (CPU, display, modem, wakelocks, thermal, base).
  • Detects abnormal idle drain, runaway modem, GPU stuck at max.
  • Pairs with the oscilloscope's Power Draw channel for time analysis.
Thermal map — virtual phone FLIR (60 sensors)

Thermal map

Thermal map — virtual phone FLIR (60 sensors)

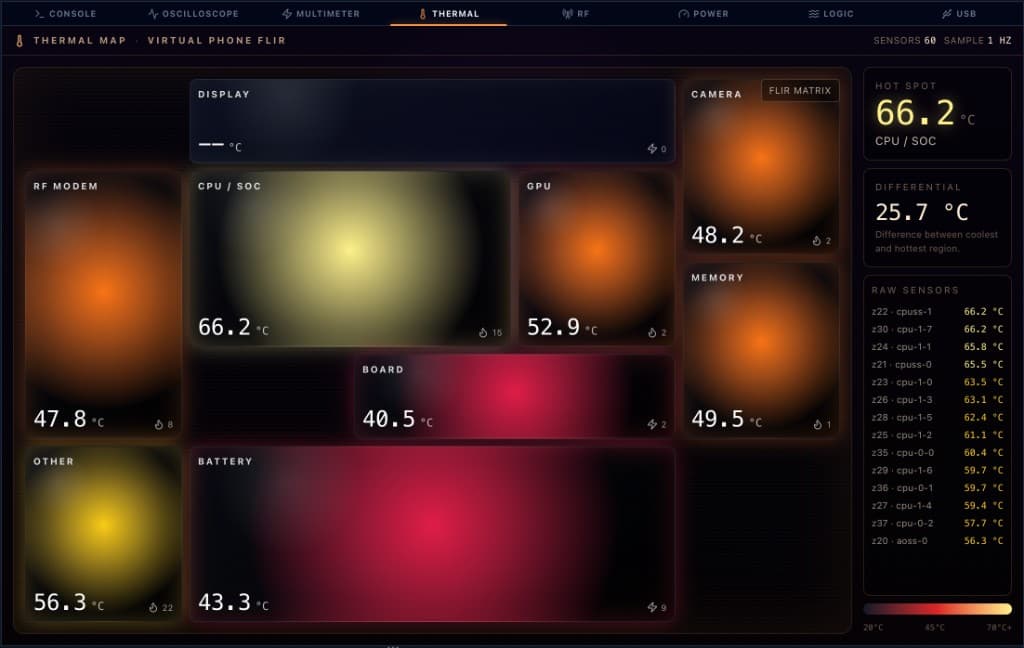
Spatial reconstruction of every thermal zone the SoC exposes: display, CPU/SoC, GPU, board, memory, RF modem, camera, battery.

Reads `/sys/class/thermal/thermal_zone*` (Android) and IOHID thermal sensors (iOS), classifies each sensor by physical region and renders it as a heatmap blob with the live temperature in °C. The hot-spot, the cold-spot and the differential between them appear on the right strip with the raw sensor table.

  • Up to 60 raw sensors visible simultaneously (z0…z59).
  • Hot-spot tracker: name of the zone + temperature, refreshed every second.
  • Differential metric: distance between coldest and hottest sensor → indicates thermal balance.
  • Useful for: detecting reballed silicon running hotter, broken VC, paste-degraded boards.
Logic analyzer — 8 digital system traces

Logic analyzer

Logic analyzer — 8 digital system traces

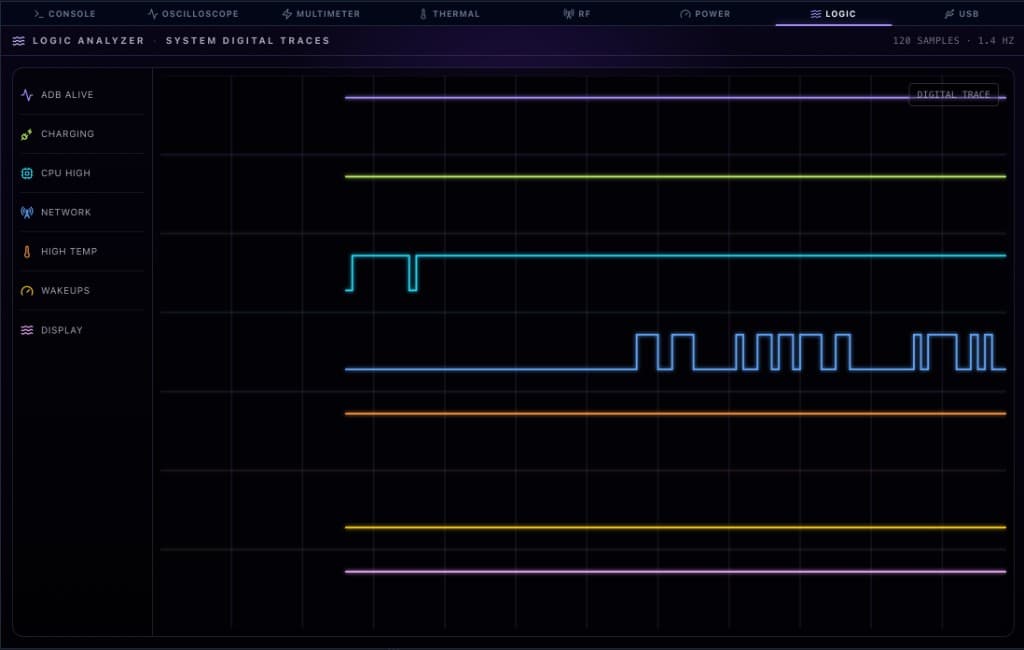
ADB Alive, Charging, CPU High, Network, High Temp, Wakeups, Display — 8 binary signals plotted as digital traces over time.

Each row is a boolean condition computed from real telemetry (charging plugged, CPU > 80 %, network traffic crossing threshold, temperature > 60 °C, wakelock active, display on). Lets you spot patterns the technician would otherwise miss in raw logs: wake-up loops, intermittent ADB drops, charging cycles, screen-on bursts.

  • 8 digital channels, 120 samples, 1.4 Hz native refresh.
  • Pulse-width visible: short blips vs continuous high states.
  • Cross-correlation: charging + CPU spike + display on at the same time = unboxing burst.
  • Persistent buffer: scroll back to inspect historical edges without losing live capture.
RF analyzer — cellular / WiFi waterfall

RF analyzer

RF analyzer — cellular / WiFi waterfall

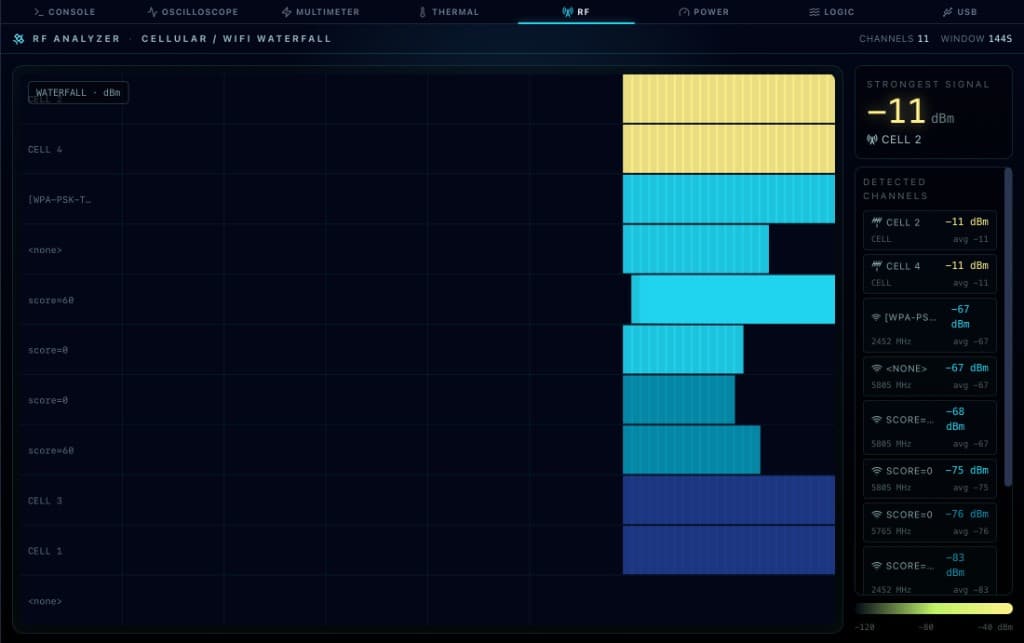
Live spectrum-style waterfall of the channels the phone is seeing right now: cellular cells with neighbor info + WiFi BSSIDs with RSSI.

Combines `dumpsys telephony.registry` (LTE/NR neighbor cells, signal strength, score) with `wpa_supplicant` scan results (WiFi SSIDs, frequency, RSSI). Colors map dBm linearly — bright yellow is strongest, dark blue is weakest. The right strip lists every detected channel with its average dBm so you can spot a SIM card seeing only 1 weak cell or a phone glued to an old AP.

  • Up to 11 channels in the window, refreshed every 144 s.
  • Cellular + WiFi mixed view — same scale.
  • Strongest signal callout (e.g. CELL 2 at -11 dBm).
  • Useful for: roaming validation, WiFi black-spots, antenna damage diagnosis.
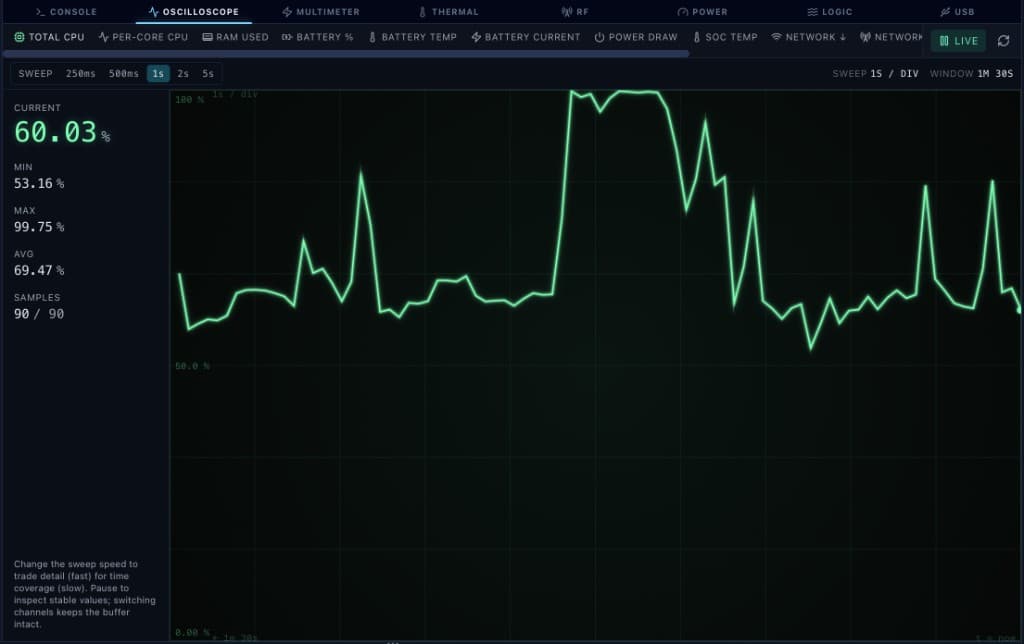
Oscilloscope — Total CPU %

Oscilloscope

Oscilloscope — Total CPU %

Continuous trace of total CPU load. Pause to inspect spikes, change the sweep speed to trade detail vs time coverage.

Reads `/proc/stat` deltas every sample window and plots them as a classic scope trace. Current value on the left, plus min / max / avg / sample count. The pinned channel persists across panel changes — switching to RAM Used or Battery Current does not reset the buffer.

  • Channels available: Total CPU, Per-core CPU, RAM, Battery %, Battery Temp, Battery Current, Power Draw, SoC Temp, Network ↑/↓, Load Avg 1m, Refresh Rate.
  • Sweep options: 250 ms · 500 ms · 1 s · 2 s · 5 s per division.
  • Window: 1 min 30 s by default with circular buffer.
  • Pause / resume / live mode toggle to inspect frozen captures.
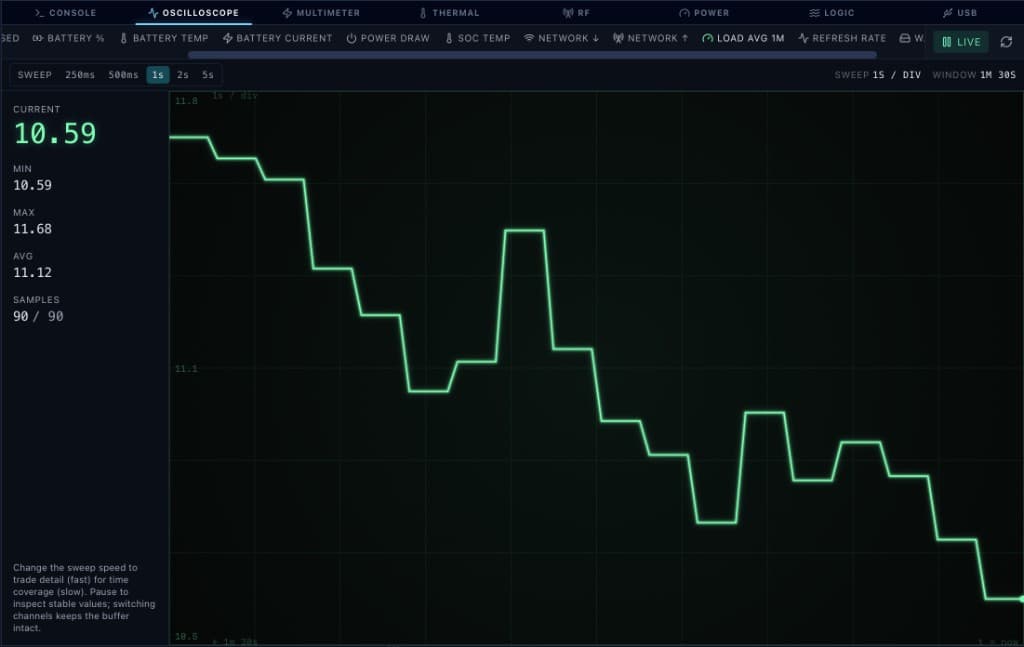
Oscilloscope — Load Average 1 min

Oscilloscope

Oscilloscope — Load Average 1 min

UNIX load average reading directly from `/proc/loadavg` — the real metric kernel engineers use to spot scheduler congestion.

Different from CPU %: load includes processes waiting on I/O, not just CPU‑bound work. A load of 10 on an 8‑core SoC means the scheduler queue is twice as long as the core count. Useful when CPU % seems low but the phone still feels laggy.

  • Raw kernel metric (no smoothing applied).
  • Easy to spot scheduling backlog vs pure CPU saturation.
  • Pairs well with Per-core CPU to find unbalanced workloads.
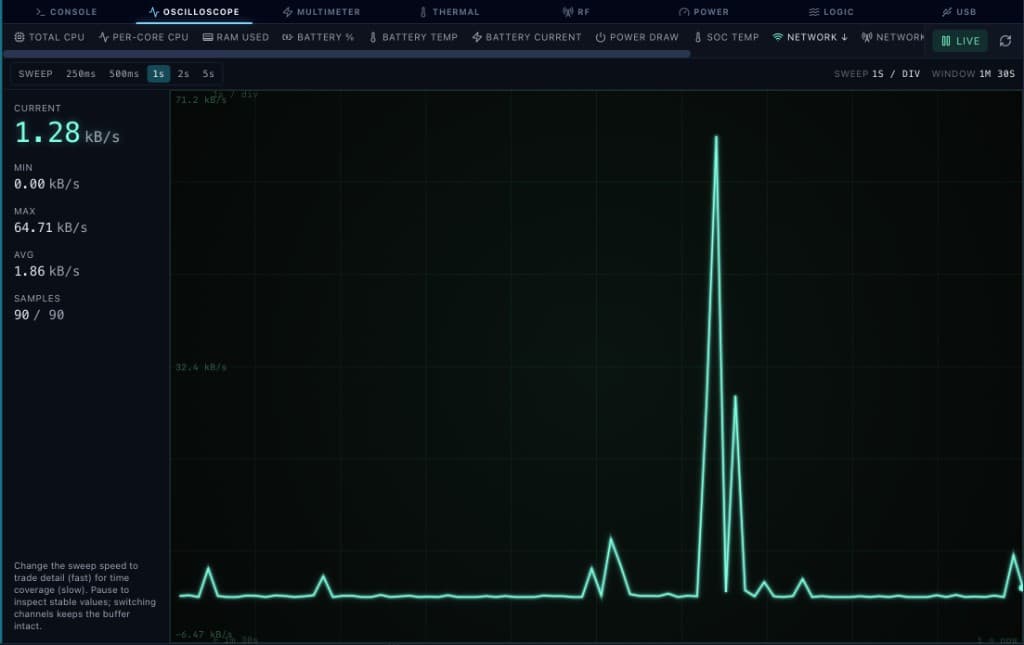
Oscilloscope — Network ↓ (download)

Oscilloscope

Oscilloscope — Network ↓ (download)

Live download throughput from the active interface (cellular or WiFi), sampled directly from `/proc/net/dev`.

Inverse companion of Network ↑. Together they help diagnose flaky carriers, malware exfiltration patterns, background sync storms (Google Photos backup, app updates) or simply confirm the SIM is delivering real bandwidth before handing the phone to the customer.

  • Per-second resolution, peak detection in the side panel.
  • Visualizes burst patterns common to ad SDKs and background syncs.
  • Pairs with the RF waterfall to correlate signal quality with effective throughput.
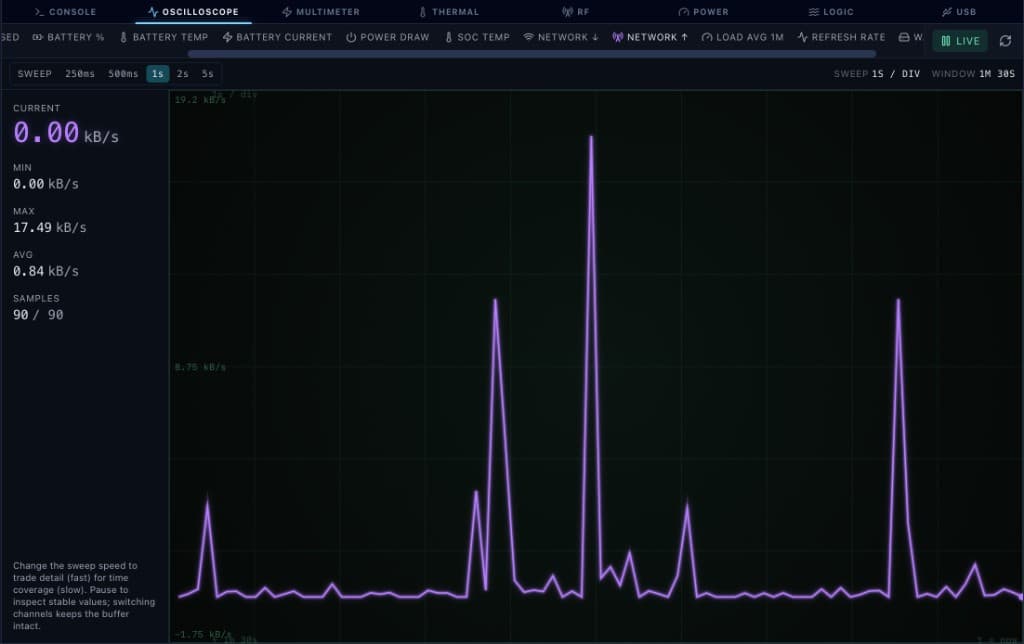
Oscilloscope — Network ↑ (upload)

Oscilloscope

Oscilloscope — Network ↑ (upload)

Live upload throughput. Spots phones leaking bandwidth via background trackers, fraudulent SDKs or rogue VPN apps.

Same source as Network ↓ but for the TX counters. A device sitting idle on the bench should peak under 5 kB/s upload; sustained higher rates with the screen off are a clear telltale of unwanted background traffic.

  • Detects: covert telemetry, rogue VPNs, malware exfiltration, ad fingerprinting.
  • Per-interface (cellular or WiFi) — switch via the same dashboard radio.
  • Combined with `logcat` filtering by package, identifies the offending app.
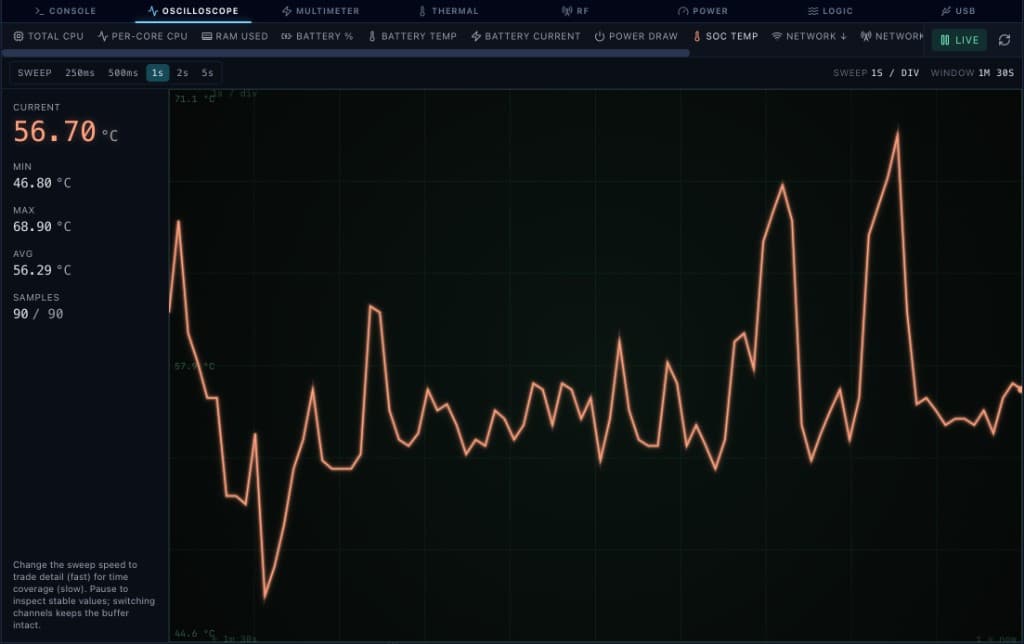
Oscilloscope — SoC Temperature

Oscilloscope

Oscilloscope — SoC Temperature

Hot-spot of the silicon over time. Drives the thermal-map hot-spot callout and is the first signal of thermal throttling.

Reads the warmest CPU thermal zone every sample. A healthy phone at idle stays around 35-45 °C; during sustained load you may see 70 °C; above 85 °C the kernel starts throttling. Useful to verify a reballed CPU or to confirm thermal paste quality after a screen swap.

  • Source: `/sys/class/thermal/thermal_zone*` warmest zone.
  • Spots thermal throttling onset before it becomes visible to the user.
  • Pairs with the Thermal Map to localize the hot region in space.
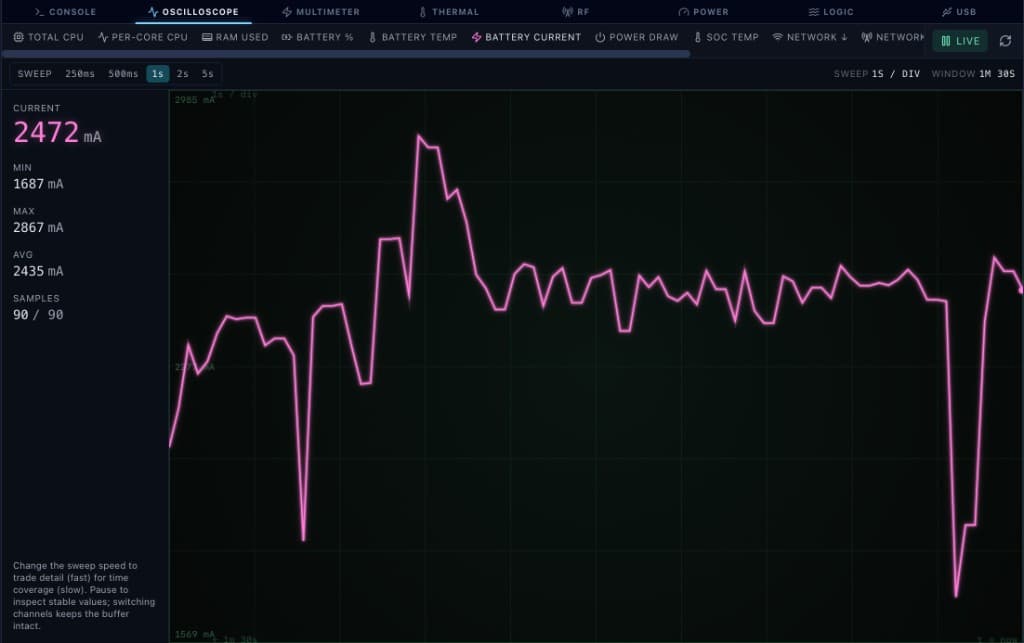
Oscilloscope — Battery current

Oscilloscope

Oscilloscope — Battery current

Instantaneous current in mA. Positive = charging in, negative = discharge. Spots erratic chargers and bad cells.

A healthy fast-charging session draws 1.5-3 A in pulses; a damaged charging IC or a sulfated cell drops the current to single hundreds of mA. The dips you see in the trace are typical of charge-current modulation by the PMIC as the SoC enters thermal CV mode.

  • Detects: dead charging IC, bad USB cable, swollen cell, thermal CV folding.
  • Sign indicates direction: + (charging) / − (discharging).
  • Pair with Power Draw to compute instantaneous efficiency.
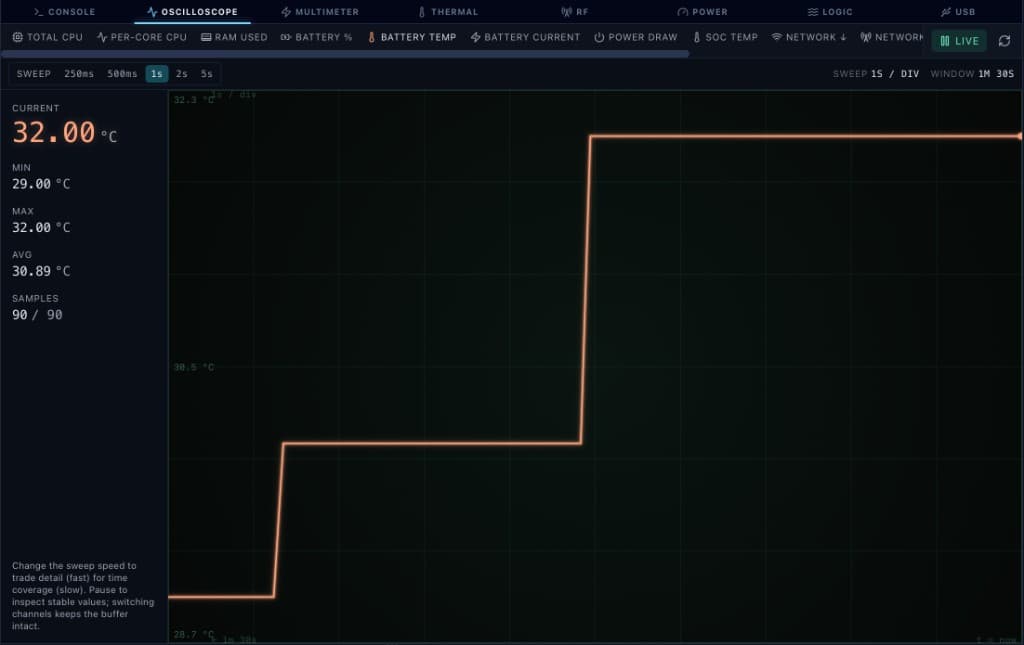
Oscilloscope — Battery Temperature

Oscilloscope

Oscilloscope — Battery Temperature

Stepped trace because the battery thermistor only reports in 1 °C increments. Spots overheating cells before they swell.

Anything above 42 °C while charging is a warning sign. Sustained 45 °C on idle is a swollen-cell predictor. The discrete steps you see in the trace are not noise — they are the real resolution of the battery thermistor.

  • Discrete 1 °C resolution — that is the hardware limit, not a bug.
  • Alerts when sustained > 42 °C while charging.
  • Critical predictor of swelling before visible deformation.
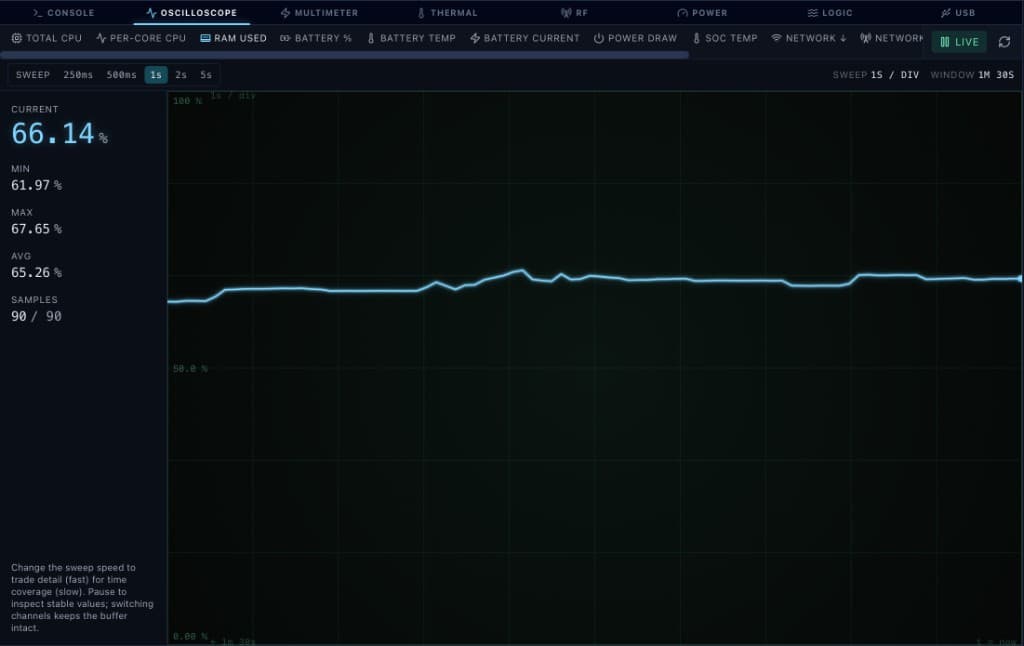
Oscilloscope — RAM used %

Oscilloscope

Oscilloscope — RAM used %

Memory pressure relative to total RAM. Stable around 65-70 % on modern phones is normal; sustained > 90 % means an app is leaking.

Reads `MemTotal` minus `MemAvailable` from `/proc/meminfo`. Useful to spot memory leaks (gradual climb), aggressive caching by a specific app, or to validate that lowmemorykiller is doing its job under load.

  • Source: `MemAvailable` from `/proc/meminfo` (kernel's own metric).
  • Detects memory leaks and runaway processes.
  • Pair with `dumpsys meminfo` to identify the offending PSS allocator.
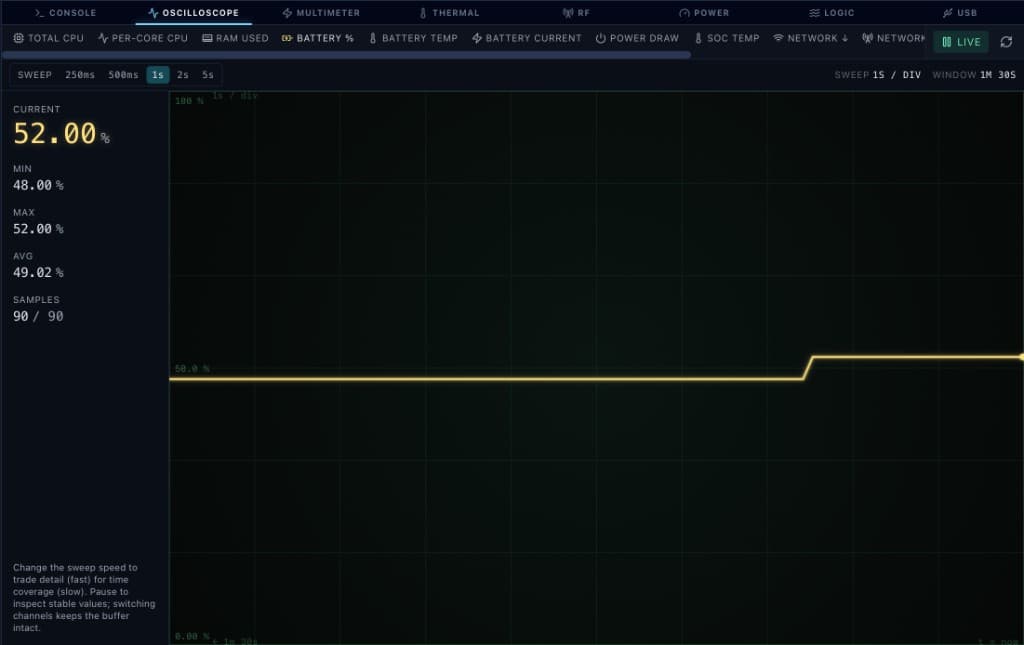
Oscilloscope — Battery %

Oscilloscope

Oscilloscope — Battery %

Coarse 1 % step over time. Useful to confirm a charge curve is monotonic and that the fuel gauge is not jumping erratically.

If you see this trace flipping back and forth between two values, the fuel-gauge calibration is broken — typical of a phone that was opened without resetting the BMS chip. Use the Battery Diagnostic flow (Service → Battery) to re-calibrate.

  • Validates fuel-gauge monotonicity — flipping = bad calibration.
  • Predicts when the customer will run out before a long session.
  • Pair with current and voltage to compute remaining time-to-empty.

Everything you just saw runs inside the desktop app.

Download LandBech Tool, connect a phone via USB, and the instruments switch on automatically.